Model Selection Training Pipeline
Design Overview
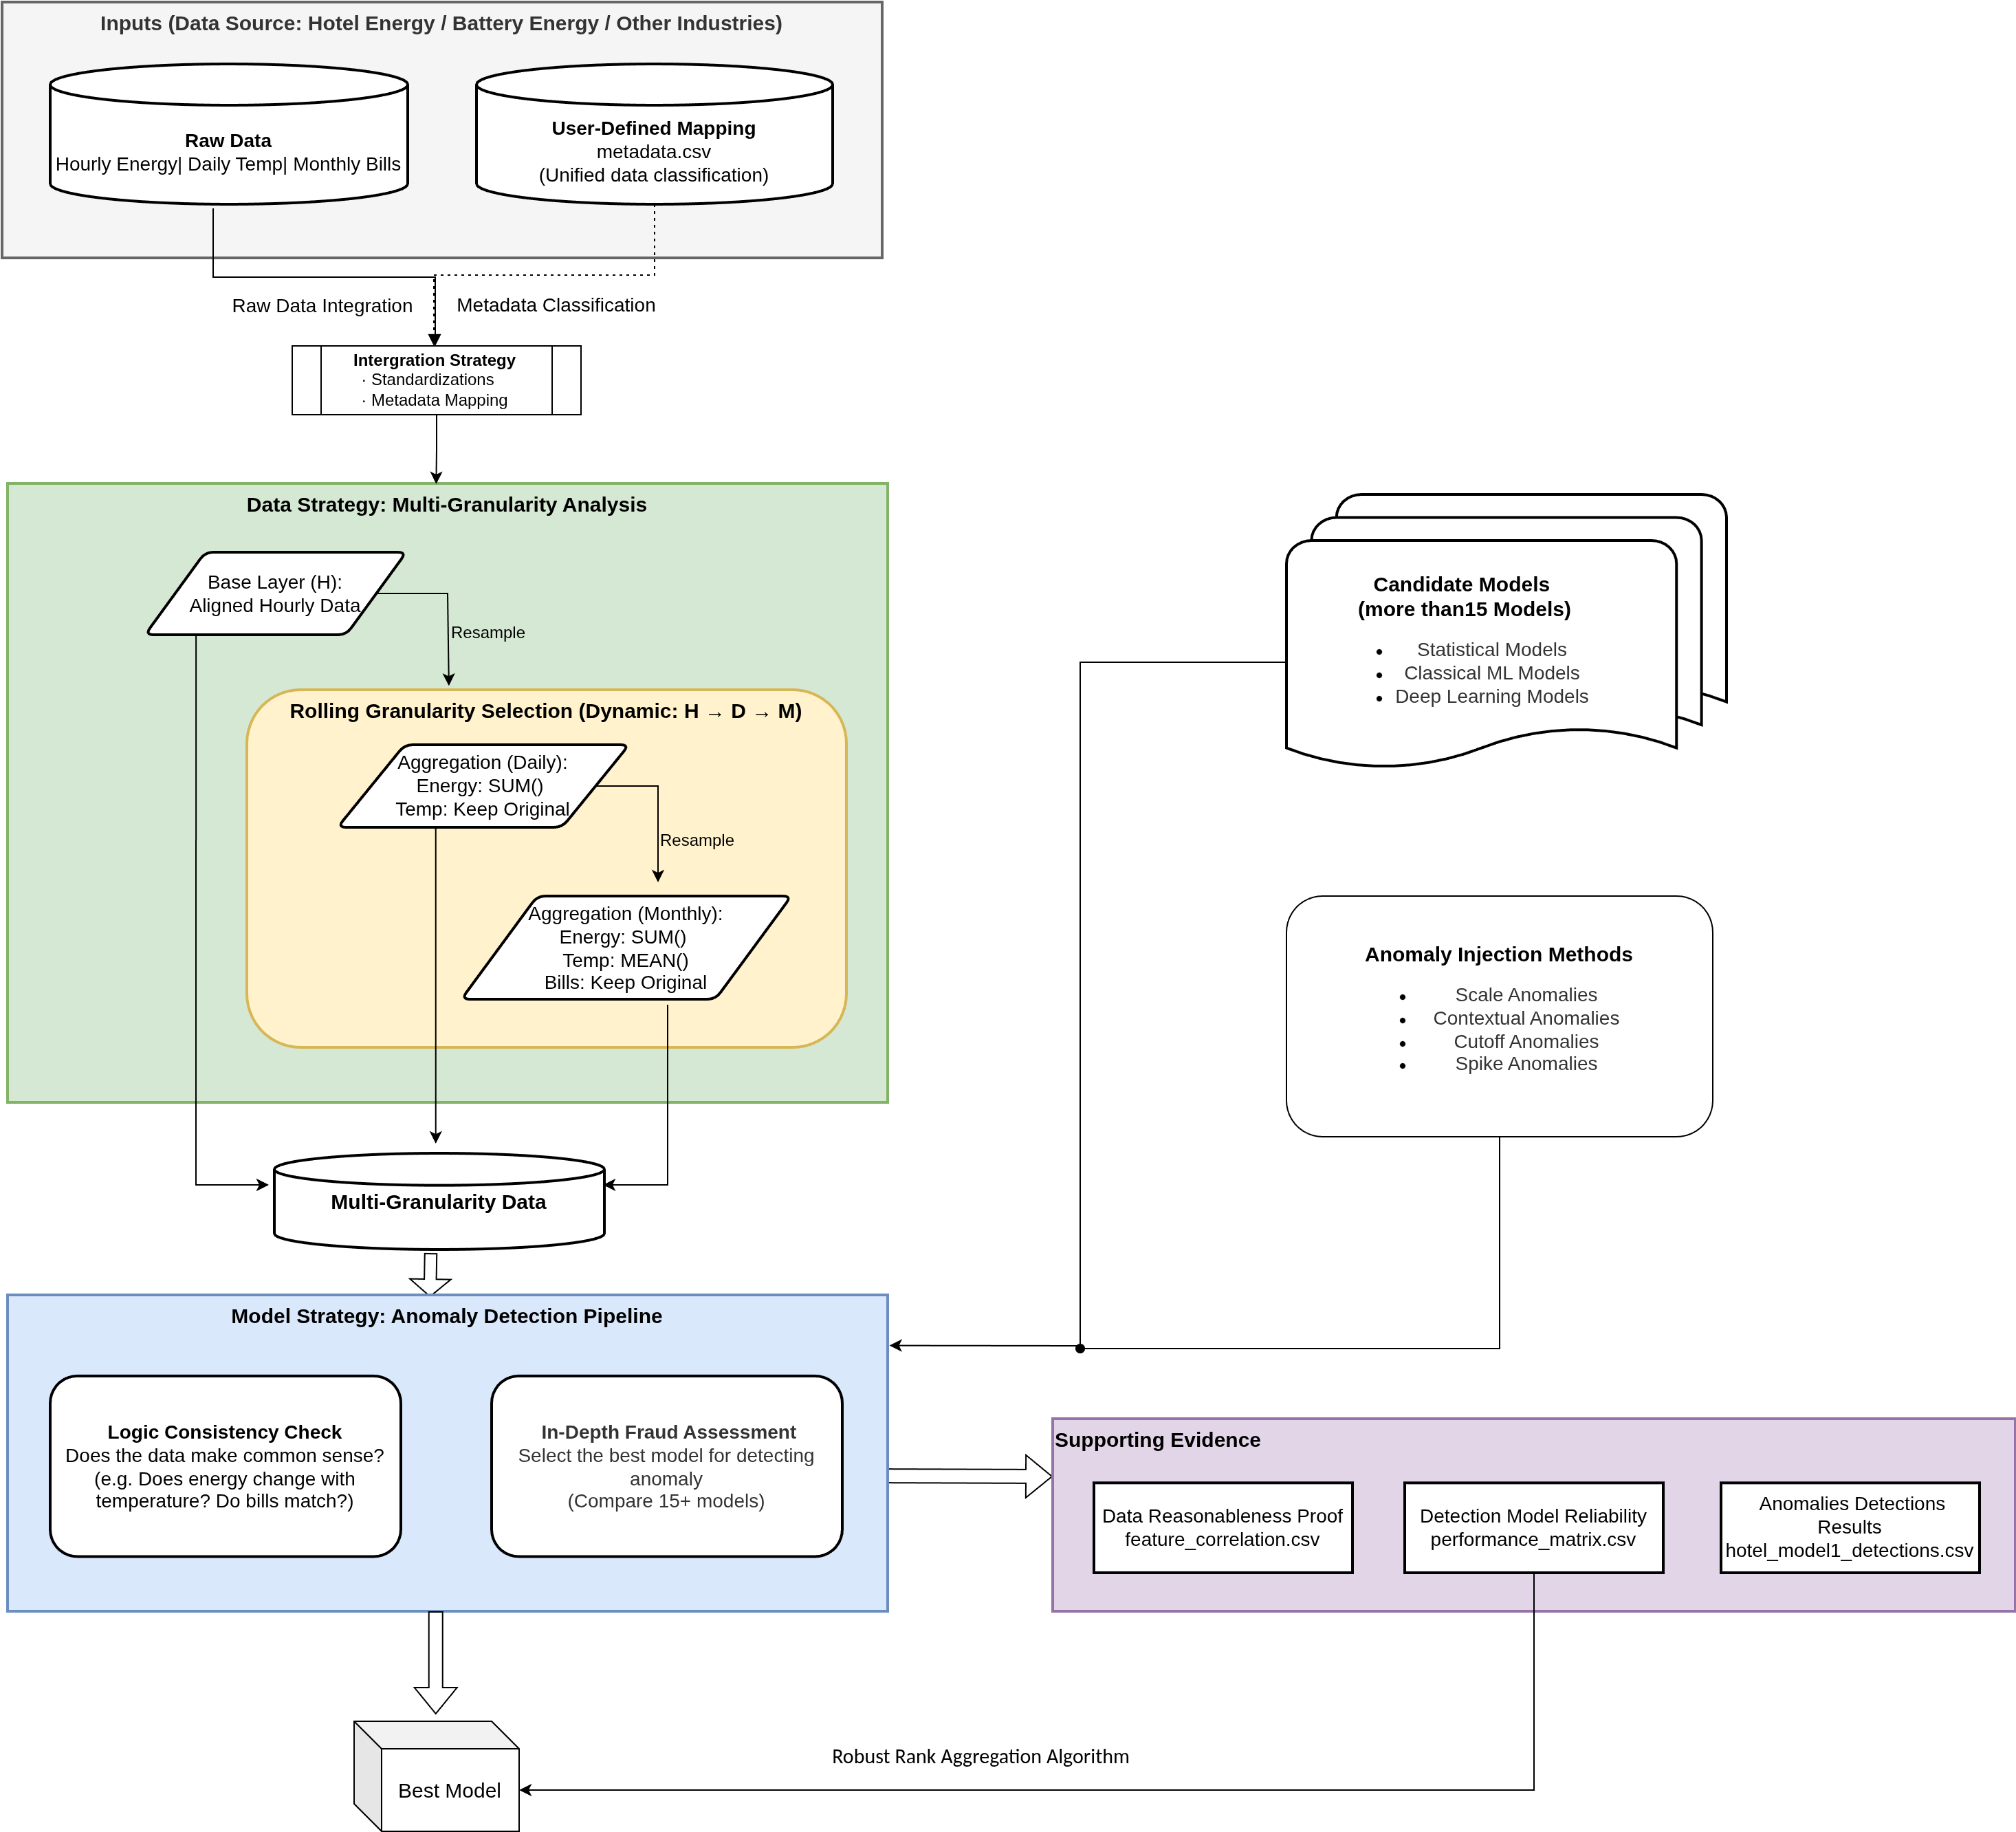
This pipeline provides a systematic and extensible framework for selecting the most suitable unsupervised time-series anomaly detection model for carbon emission verification and energy data validation. Given that real-world energy datasets are typically unlabelled, multi-source, and heterogeneous, the design prioritizes robustness, interpretability, and adaptability to diverse operational contexts while ensuring the selected model can reliably detect subtle anomalies such as double counting, green washing, or sensor failures.
The architecture is deliberately modular, allowing seamless integration of new models and data sources without redesigning the core logic—an essential feature for long-term scalability across different industries (e.g., hotels, battery storage systems, or other commercial facilities).
1. Data Strategy: Multi-Granularity Analysis
Energy consumption data inherently exists at multiple temporal scales, each serving a distinct verification purpose. The pipeline therefore implements dynamic resampling across three granularities:
- Hourly (H) (e.g.: Operational Granularity): Captures high-frequency patterns and short-term operational anomalies (e.g., equipment running during off-hours).
- Daily (D) (e.g.: Physical Granularity): Aggregates energy consumption (
SUM) and aligns it with environmental factors such as temperature, revealing physical consistency between consumption and external conditions. - Monthly (M) (e.g.: Financial Granularity): Aggregates data to match billing and reporting cycles, providing the ultimate cross-check against financial records.
This multi-granularity design is driven by the intrinsic characteristics of real-world energy systems: anomalies may manifest differently depending on the time scale. Evaluating models at all three levels ensures the final selection is effective for both immediate operational monitoring and long-term financial/carbon auditing.
2. Integration Strategy: Standardization and Metadata Mapping
Real-world energy data often originates from heterogeneous sources (IoT sensors, smart meters, manual logs) with inconsistent scales, naming conventions, and formats. To address this challenge, the pipeline incorporates broadcasting of exogenous variables, date alignment, and Z-score standardization, all guided by a user-defined metadata.csv mapping file.
This approach eliminates scale-induced bias and naming inconsistencies, allowing every model to focus purely on temporal patterns and contextual relationships. The metadata-driven design also ensures high extensibility: new data sources or entities can be incorporated simply by updating the mapping file, without any changes to the model code.
3. Model Strategy: Three Complementary Categories
Rather than relying on a single “best” model, the pipeline systematically evaluates more than 15 unsupervised candidates across three complementary categories:
- Statistical Models (fast, interpretable baselines):
Include Running Mean (detects deviations from local average), Mean Deviation (measures statistical dispersion), and Linear Regression (identifies trend-based anomalies). These models are particularly effective for catching obvious spikes, sensor drops, or sudden shifts that do not require complex intelligence. - Classical Machine Learning Models (multi-dimensional outlier detection):
Include Nearest Neighbors (distance-based outlier detection) and One-Class SVM (boundary-based anomaly detection). They excel at identifying cases where multiple features become inconsistent simultaneously (e.g., high energy consumption despite low temperature). - Deep Learning Models (complex temporal and contextual modeling):
Include RNN/LSTM (sequential dependency modeling), LSTM-VAE (reconstruction-based anomaly scoring via variational autoencoders), Anomaly Transformer (attention mechanisms for capturing long-term dependencies), and DGHL (Deep Generative Hierarchical Likelihood for high-dimensional time series). These models are essential for detecting subtle, non-linear manipulations such as green washing that appear normal in isolation but break long-term patterns.
By comparing models from all three families, the pipeline guarantees that the final selection is both robust and well-matched to the specific characteristics of the dataset, while remaining future-proof for the addition of new architectures.
4. Evaluation Strategy: Synthetic Anomaly Injection
True labelled anomalies are extremely rare in carbon verification projects. To overcome this limitation, the pipeline employs synthetic anomaly injection as a controlled proxy for model performance evaluation.
Specifically, four types of anomalies are programmatically injected into the clean time-series data:
- Scale anomalies (e.g., sudden 2× or 0.5× spikes) — simulating double counting or under-reporting.
- Contextual anomalies (e.g., energy spikes during unusually low-temperature periods) — simulating green washing.
- Cutoff anomalies (e.g., prolonged zero or missing values) — simulating sensor failures or data gaps.
- Spike anomalies (short, sharp deviations) — simulating transient noise or tampering.
Detection performance is then quantified using Volume Under Surface (VUS) metrics (both scale and contextual variants) and ensemble centrality (to measure how well a model agrees with the collective judgment of all candidates). This synthetic approach transforms an unlabelled problem into a reproducible, verifiable evaluation task, ensuring the selected model is not only performant but also transparent and auditable for regulatory compliance.
5. Selection Strategy: Robust Rank Aggregation (RRA) Algorithm
Inspired by Unsupervised Model Selection for Time-series Anomaly Detection, we used Robust Rank Aggregation Algorithm to select the best model.
Since no single metric (MSE, VUS, Centrality) is perfect in an unsupervised setting, we use a Robust Rank Aggregation algorithm to combine multiple viewpoints into a final verdict.
The Aggregation Logic:
Instead of simple averaging, RRA employs a Trimmed Borda / Partial Borda approach that combines multiple viewpoints while automatically mitigating the influence of noisy or inconsistent metrics:
- Individual Rankings: Models are first ranked independently based on several criteria:
- Synthetic VUS: Performance on injected fraud scenarios (Scale, Contextual, Cutoff).
- Consensus (Centrality): Degree of agreement with the collective judgment of the entire model pool.
- Forecasting Accuracy: Accuracy in reconstructing normal baseline patterns (MSE/MAE).
- Reliability Trimming: The RRA algorithm calculates the "influence" and "reliability" of each metric. It automatically "trims" or de-prioritizes metrics or models that are inconsistent outliers, ensuring the final ranking is robust against noise.
- Consensus Verdict: By aggregating these trimmed ranks, the system produces a stable, noise-resistant ranking that identifies the Best Model for the given dataset.
6. Final Output: The Deployable "Best Model"
The pipeline is not designed to just produce reports; it is an Automated Model Selector.
- Primary Artifact:
best_model_recommendation.txt. This file contains the name of the winning model (e.g.,model_2). The downstream Carbon platform reads this file to automatically load and use the correct.pthmodel for production monitoring. - Supporting Evidence:
feature_correlation.csv: Proves the data is physically plausible before selection.model_performance_matrix.csv: Presents the ranking and composite scores of all evaluated models, enabling transparent review of why a particular model was chosen._detections.csv: Sample detections from the best model for manual verification.
Summary
The pipeline's design is driven by the intrinsic characteristics of real-world energy data — unlabelled, multi-granular, and heterogeneous — while deliberately incorporating modularity, extensibility, and interpretability. This makes it a reliable, scalable, and auditable foundation for unsupervised anomaly detection in carbon emission verification and energy auditing projects.